gganime renders a ggplot2 plot written with gganimate syntax as an animated SVG. The output is a self-contained HTML widget powered by Anime.js (through the animejs package), instead of a GIF or a video.
Because the animation is a single SVG with a timeline over its attributes:
- it stays sharp at any size, since the marks are vectors rather than a raster of fixed pixels;
- the file holds one copy of the scene plus per-element keyframes, not one image per frame;
- it plays in the browser with a scrub bar, so a reader can pause and step through frames.
Installation
install.packages("gganime")Or the development version from GitHub:
# install.packages("pak")
pak::pak("long39ng/gganime")
Usage
Write the plot exactly as you would with gganimate, then call anime() instead of animate(). Here transition_time() animates over a continuous variable, sizing each country’s bubble by population and filling in the {frame_time} label between years:
library(ggplot2)
library(gapminder)
library(gganime)

p <- ggplot(gapminder, aes(gdpPercap, lifeExp, size = pop, colour = country)) +
  geom_point(alpha = 0.7, show.legend = FALSE) +
  scale_colour_manual(values = country_colors) +
  scale_size(range = c(2, 12)) +
  scale_x_log10() +
  facet_wrap(~continent) +
  labs(title = "Year: {frame_time}", x = "GDP per capita", y = "life expectancy") +
  transition_time(year) +
  ease_aes("linear")

anime(p)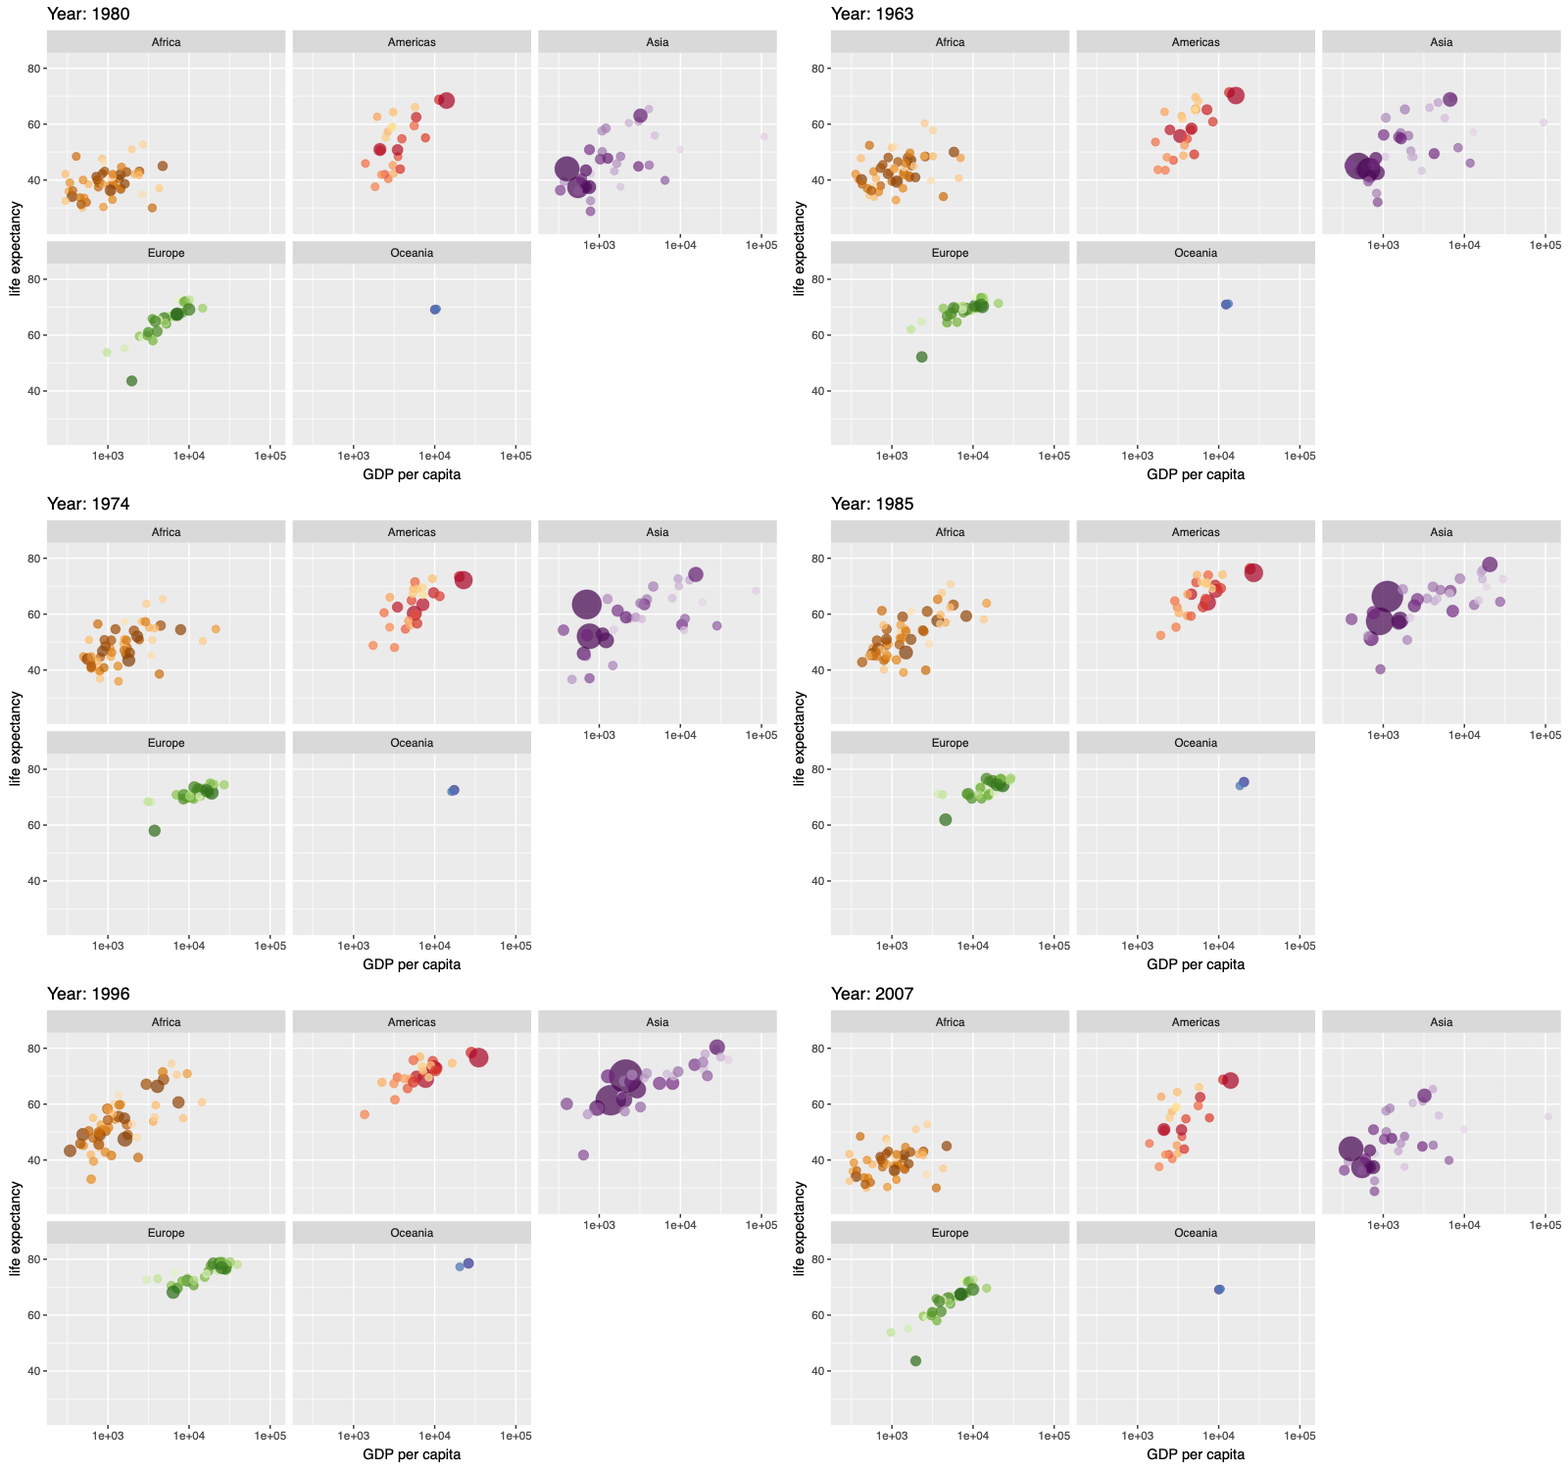
A shadow_mark() leaves earlier frames behind the current one:
p <- ggplot(airquality, aes(Day, Temp)) +
  geom_point() +
  transition_time(Month) +
  shadow_mark(colour = "grey70") +
  labs(title = "Month: {frame_time}")

anime(p)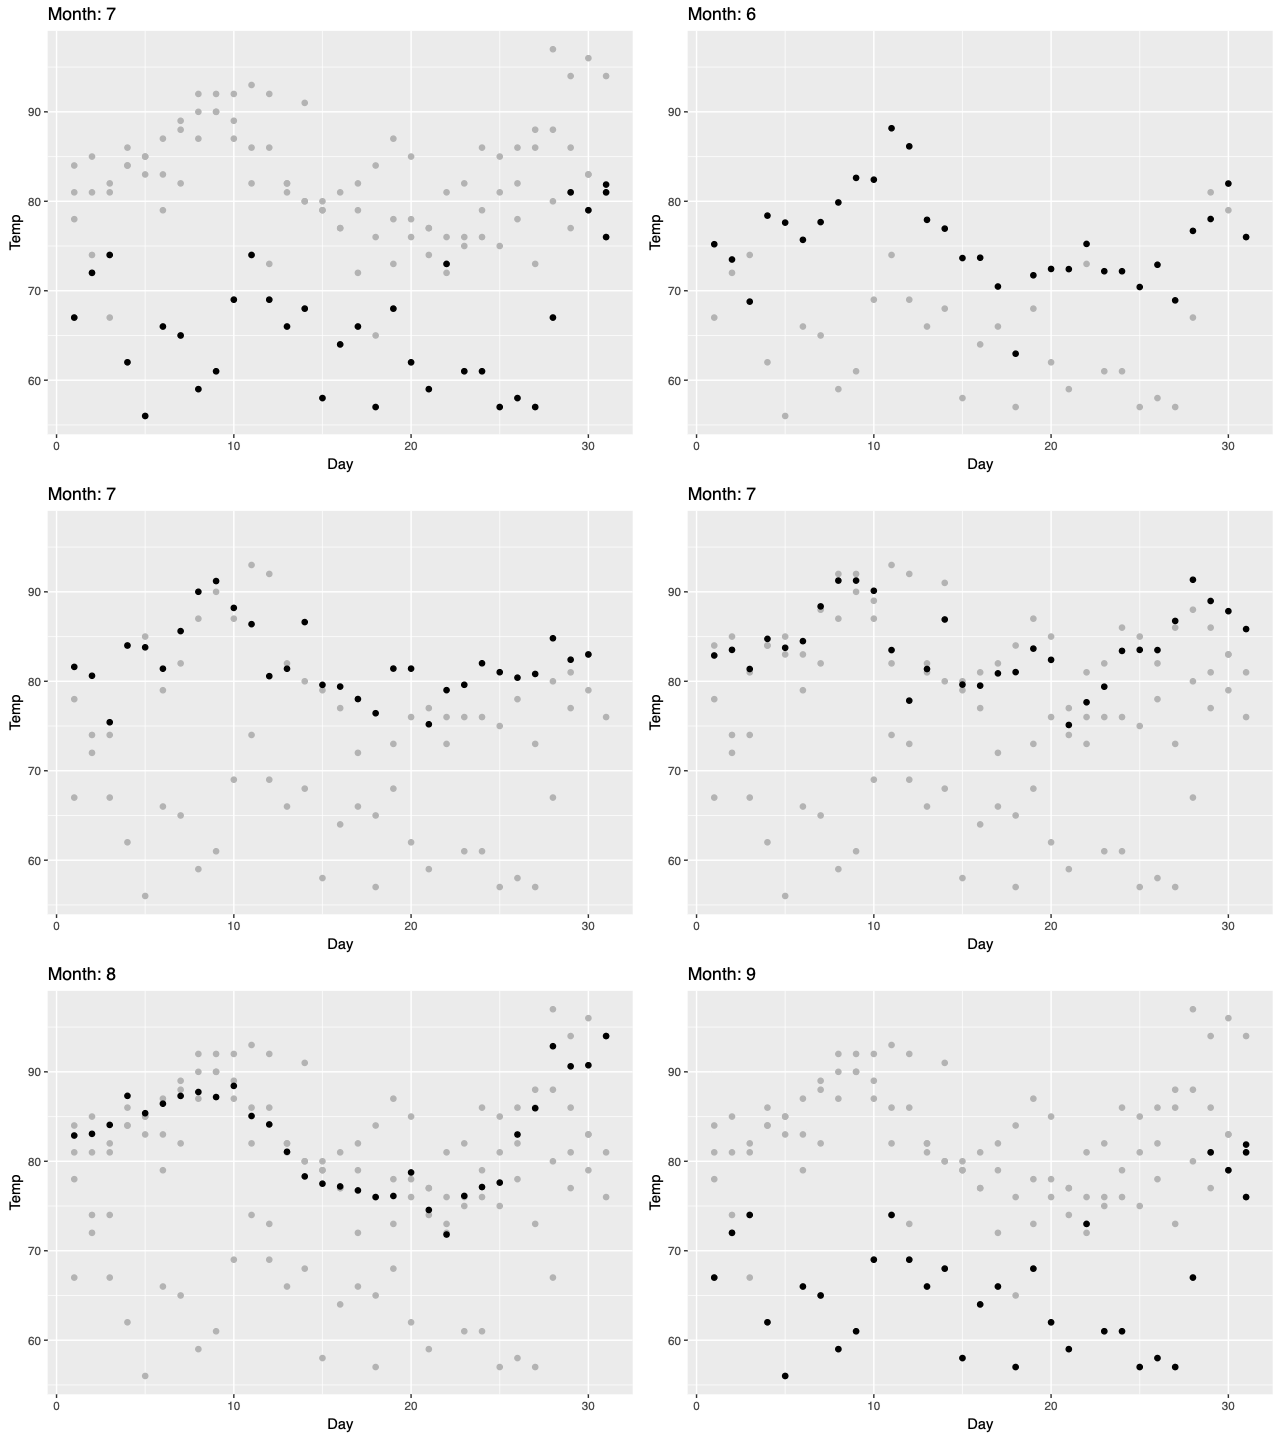
anime() returns an htmlwidget, so it prints in the RStudio Viewer, embeds in R Markdown and Quarto, and saves with htmlwidgets::saveWidget(). Loading gganime also makes a bare gganimate plot print through anime() at the console; set options(gganime.autoprint = FALSE) to keep gganimate’s own output.
In Shiny, use gganimeOutput() and renderGganime().
Supported features
- Transitions:
transition_states(),transition_time(),transition_reveal(). - Geoms: points, lines and paths, bars and columns, areas and ribbons.
- Point shapes: any pch R draws from a single shape – circles, squares, triangles, diamonds – animates its size and outline width. The shapes drawn from several parts (pch 3, 4, and 7 to 14) hold their size.
- Several layers in one plot, including two of the same kind, and a static layer beside an animated one.
- Facets:
facet_wrap()andfacet_grid(), with fixed or free scales. - Coords:
coord_cartesian(),coord_fixed()/coord_equal(), andcoord_flip(). -
enter_*()/exit_*(),ease_aes(), and per-frame labels in the title, subtitle, and caption. -
shadow_mark()andshadow_trail().
Anything else stops with a message naming the alternative. Current limits include non-Cartesian coordinate systems, shadow_wake(), and view_*() other than view_static().